Benchmarking and Reporting
See how you compare.
Win Loss Loop reporting works at every level: a single store, a dealer group, and, as the network grows, the market. Leaderboards, exception views, and cross-dealer benchmarks show whether your loss drivers are yours alone or everyone's problem.
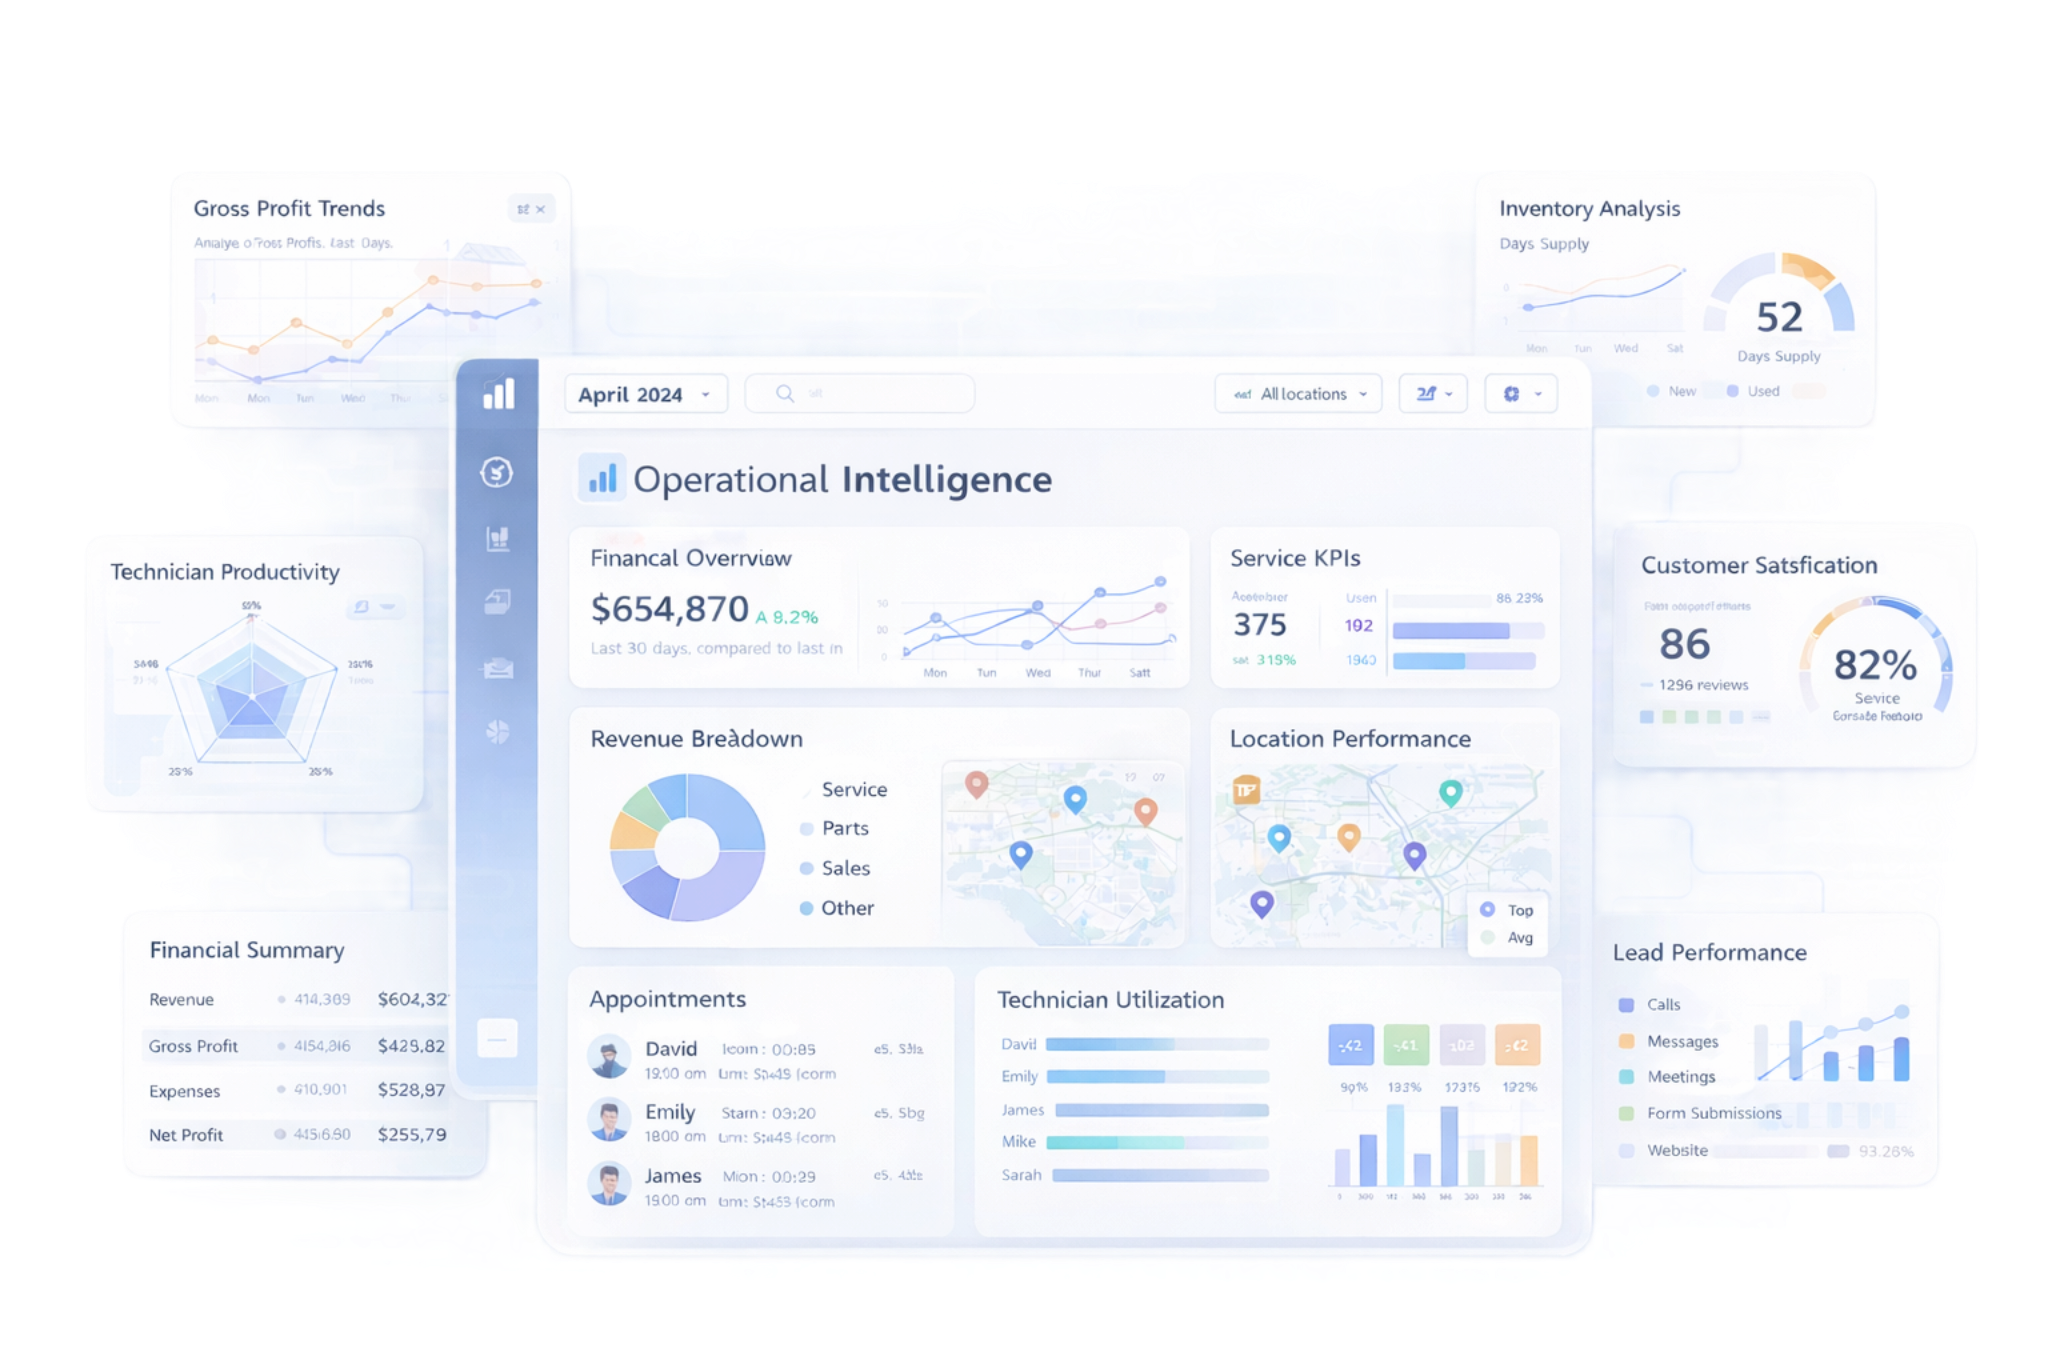
Three levels of view
The same customer feedback, read at the altitude that matters for the decision in front of you.
Store
Your loss drivers, in detail
Top reasons for lost deals by salesperson, vehicle type, and journey stage
Service friction points and return-likelihood signals
Response rates and feedback quality over time
Group
Compare rooftops, coach with evidence
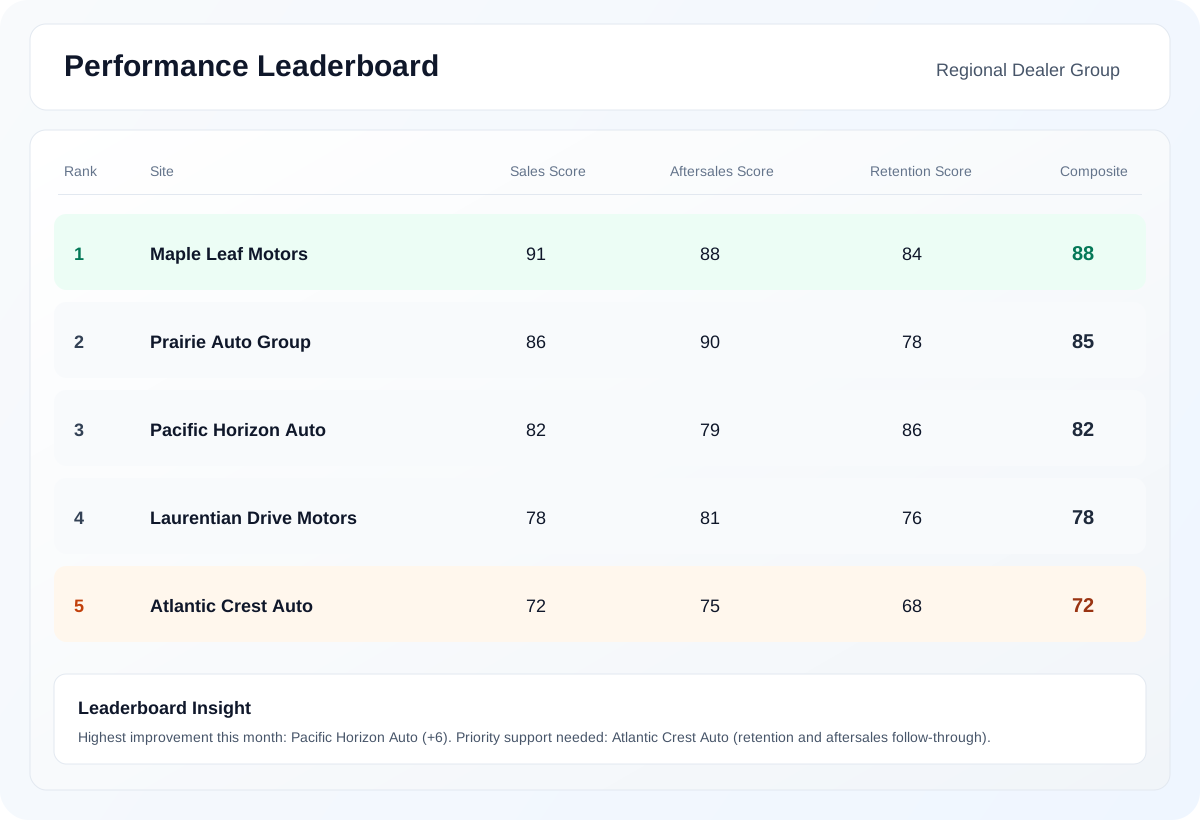
Store leaderboards on conversion, loss drivers, and customer sentiment
Exception views that flag a store drifting before the month closes
Coaching priorities ranked across the whole group
Market
Is it you, or is it everyone?
Anonymized, aggregated benchmarks across participating dealers
See whether price, trade-in, or process costs you more deals than the market average
Track how loss drivers shift by region and season
Dashboards and Exceptions
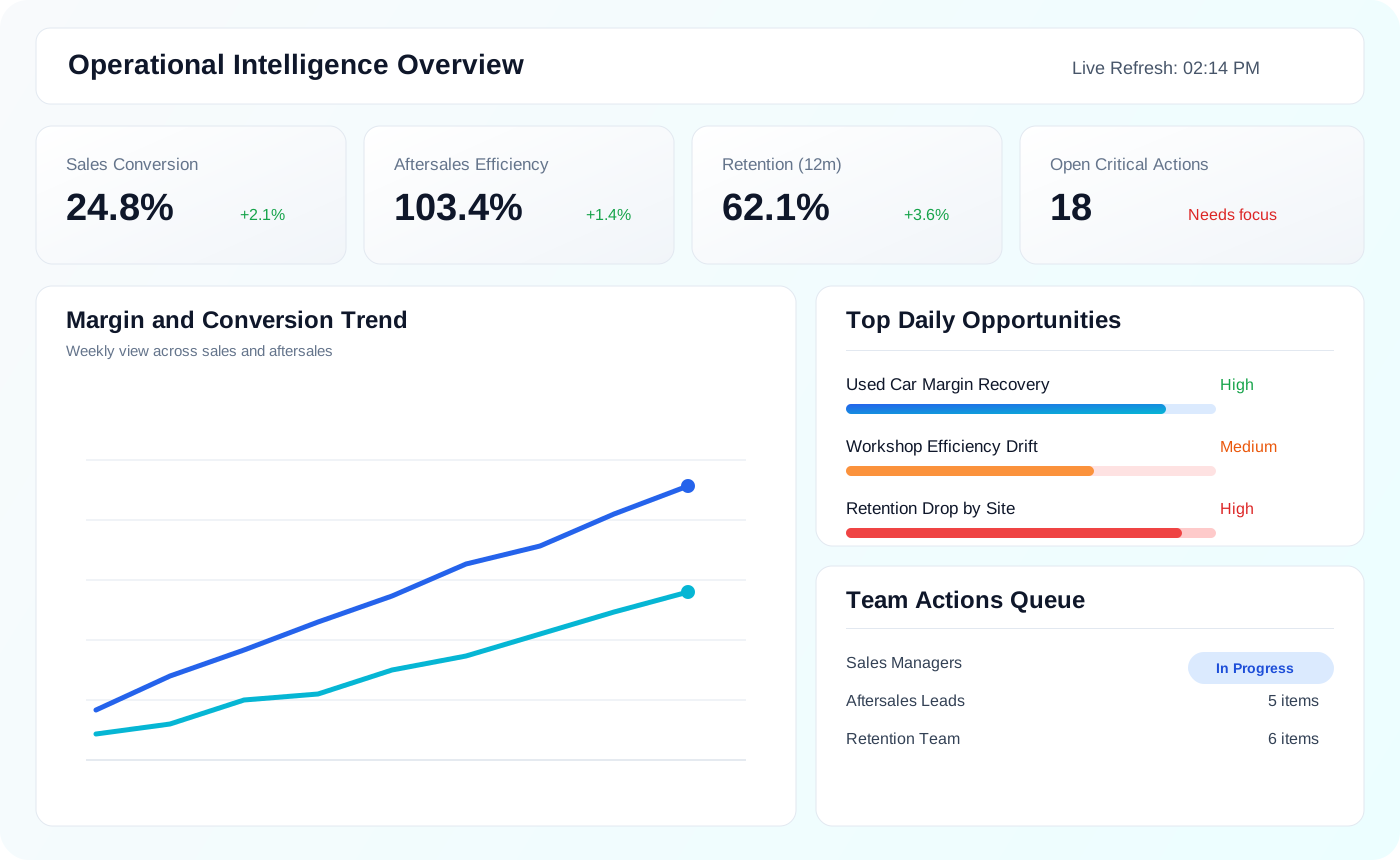
Trend lines for win rate, loss rate, and response rate sit alongside an action queue. Exception views surface a store or salesperson drifting from the pattern early enough to do something about it.
Leaderboards and Accountability
Store and role-based league tables make performance transparent. Leaders can coach with evidence, identify what the best-performing store does differently, and replicate it across the group.
How we work with you
Reporting is most useful as a rhythm, not a one-off. Win Loss Loop is delivered as an ongoing partnership: onboarding, review cycles, and benchmark targets that move as you improve.
Collaborative Onboarding
Role-based setup, CRM connection, and plain-language training for managers.
Benchmark Targets
Set realistic uplift targets from your own baseline and the market view.
Regular Review Cycles
Periodic sessions that tie the reports to actions taken and outcomes measured.
Trusted Data Governance
No dealer sees another dealer's raw data. Benchmarks are aggregated and anonymized.
Why teams adopt it
Benchmarks without exposure.
Market benchmarks are built from anonymized, aggregated responses. No dealer sees another dealer's raw data, and every contributing store keeps full control of its own.
Visit our Trust CentreAnonymized and aggregated cross-dealer data
Controlled access and role-based permissions
Auditability and accountable workflows
Canadian data-residency options
Ready to see where you stand?
We can walk through the store, group, and market views with your own numbers in mind.